Built by enlighten designs
Built for Power BI
Built by enlighten designs
Built for Power BI
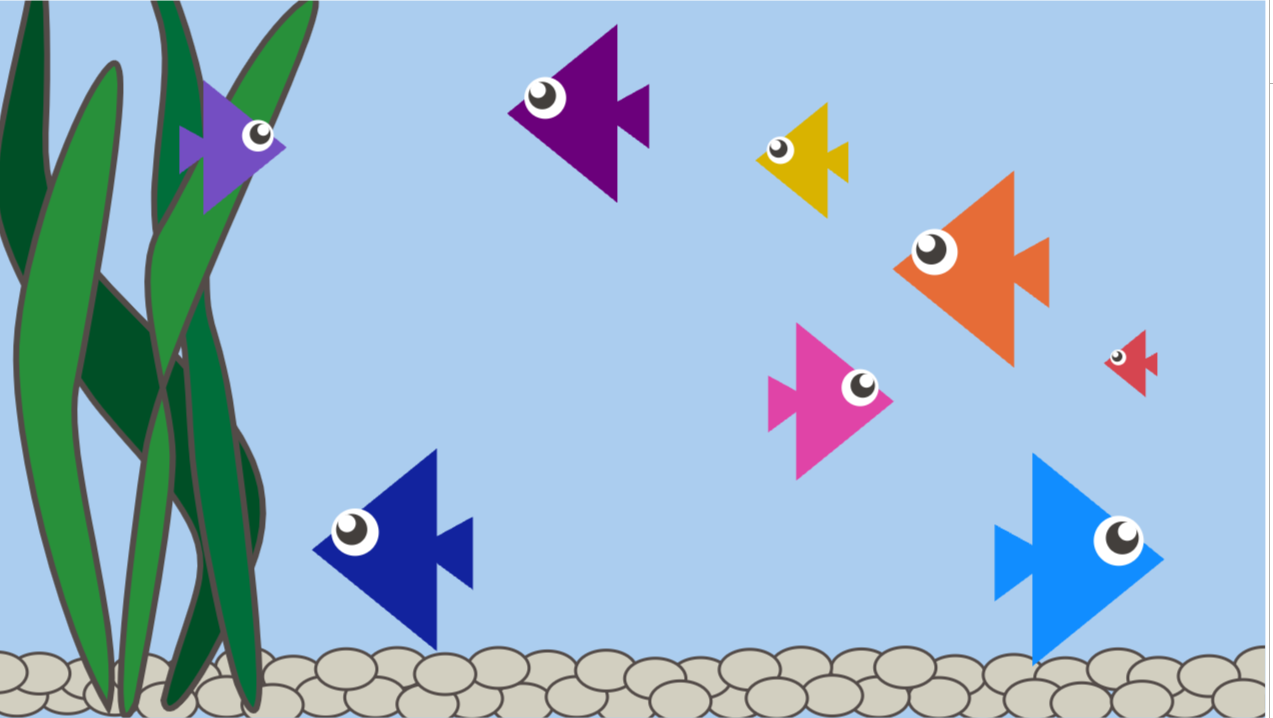
Engaging visuals, memorable data
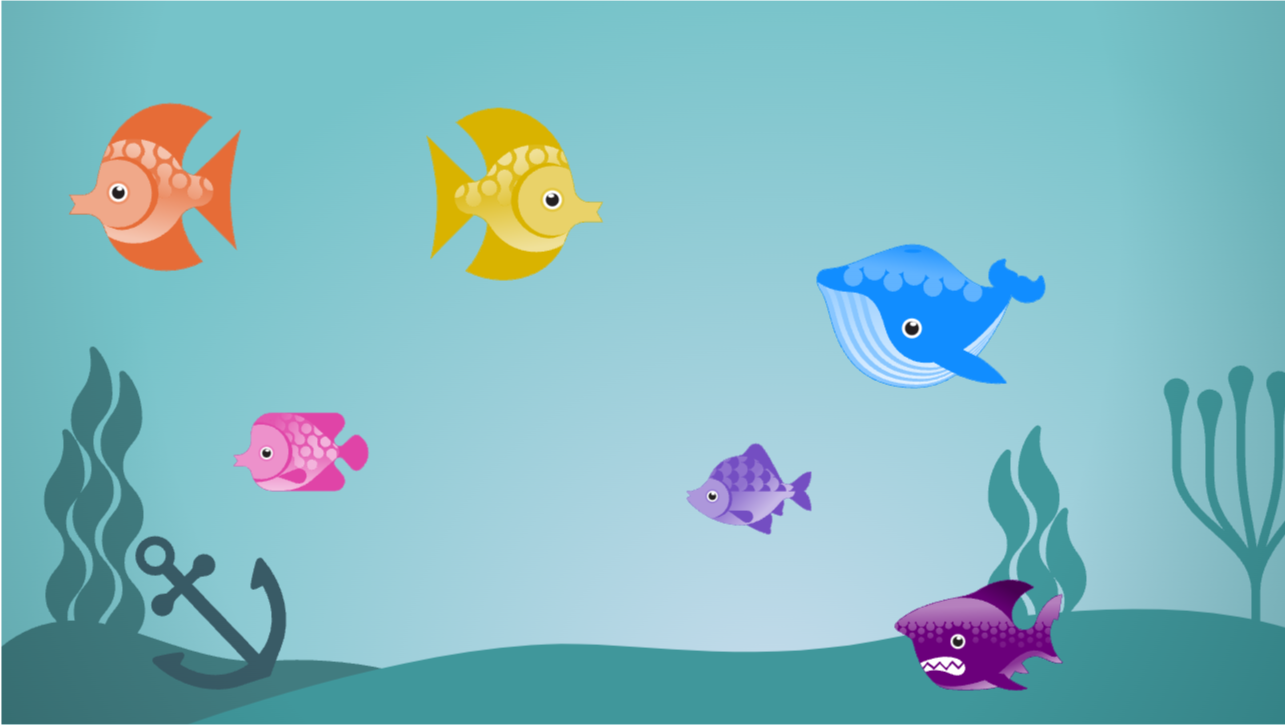
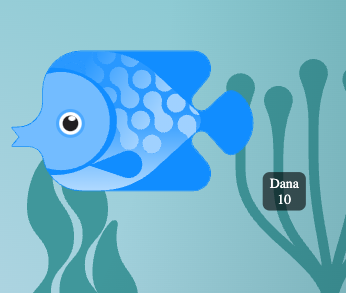
The Enlighten Aquarium combines the thrill of gamification with the power of Power BI to create a engagement visual that makes data fun and memorable.
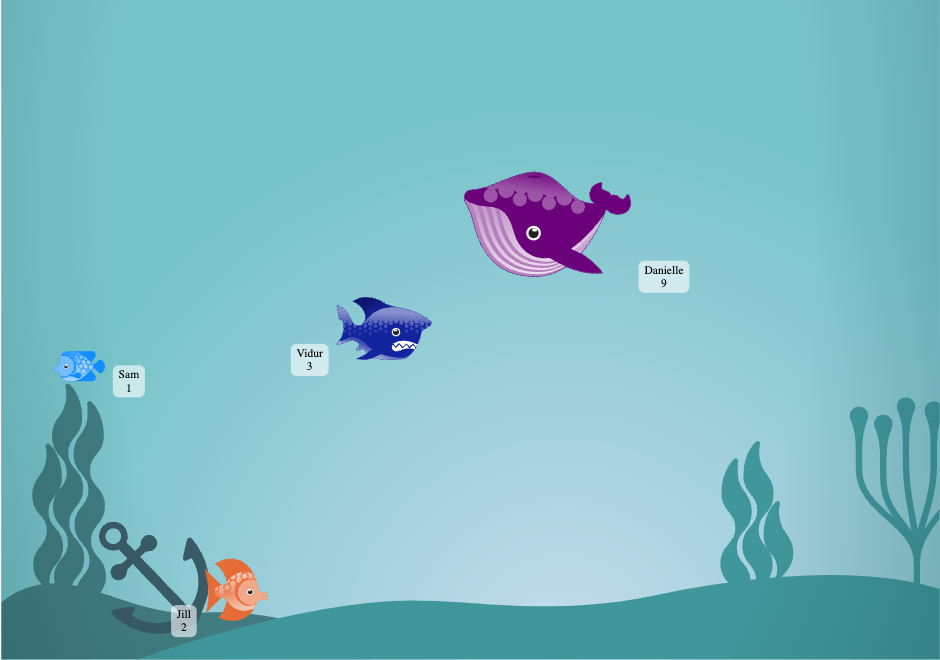
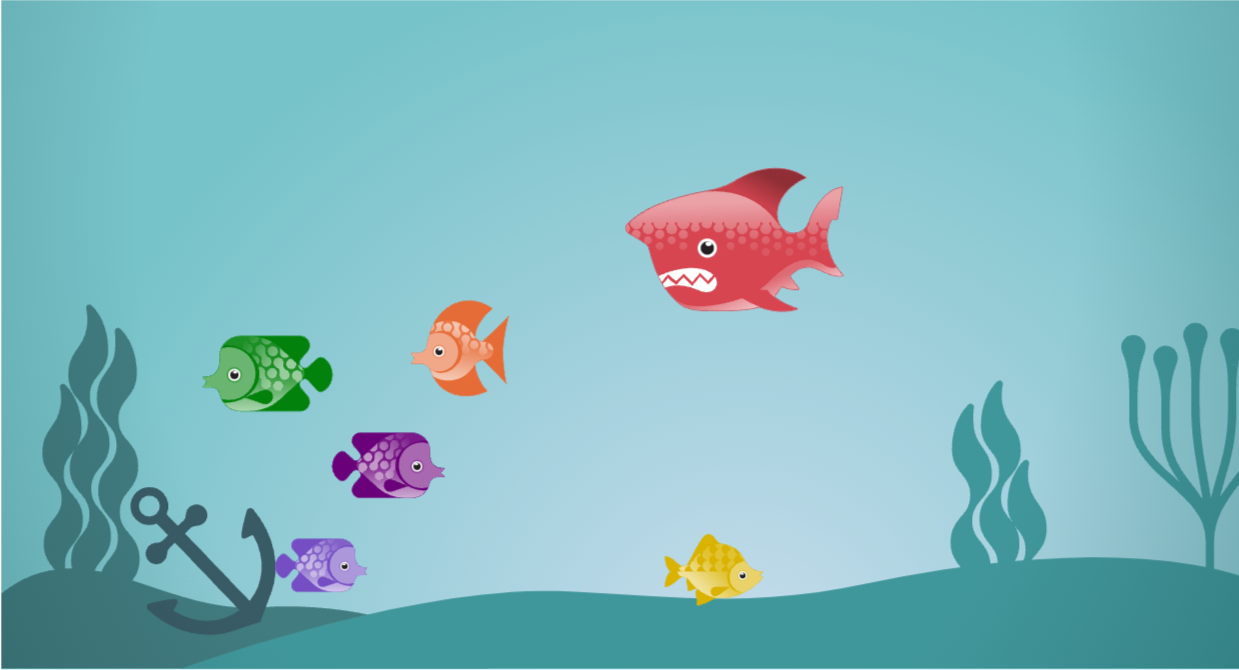
Sam has made one sale this week. Well done, Sam!
Sam is lonely though, will his teammates close any deals?
Danielle has made 9 sales this week. Danielle is a BIG whale and Sam is now a small fish.
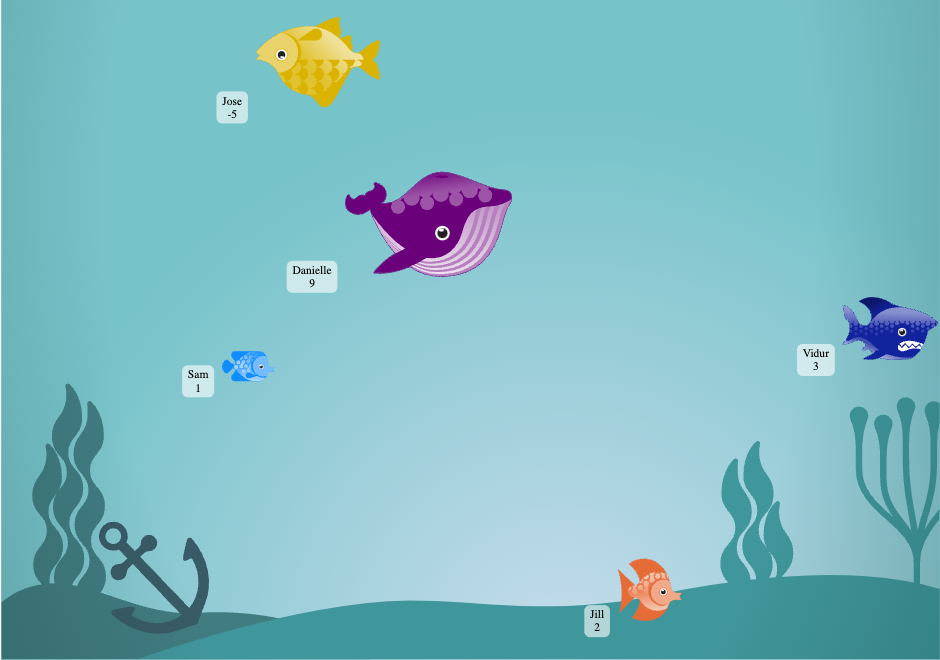
A few of Sam's other teammates now have fish in the tank as well, hoorah!
Jose had 5 rebates this week, putting him into negative. Jose's fish is now dead. RIP Jose's fish.
Will he be able to resurrect his fish next week?
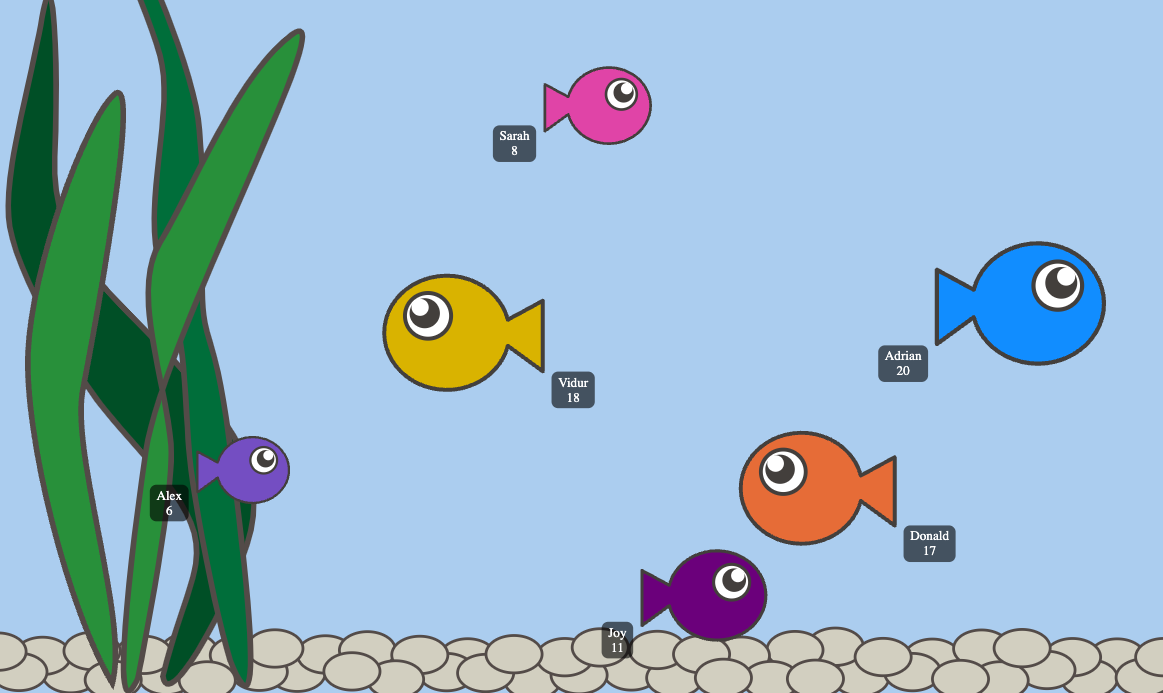
Sam has 6 opportunities in the pipeline so his fish is swimming the fastest!
“Wonderful, Easy and Creative! It helps people see how data correlates with the real world.”
“Really love this visual. In serious dashboards full of graphs and charts, everyone loves the Aquarium!”
Spot the big fish this week
Use the Aquarium to increase engagement for internal or external reporting.
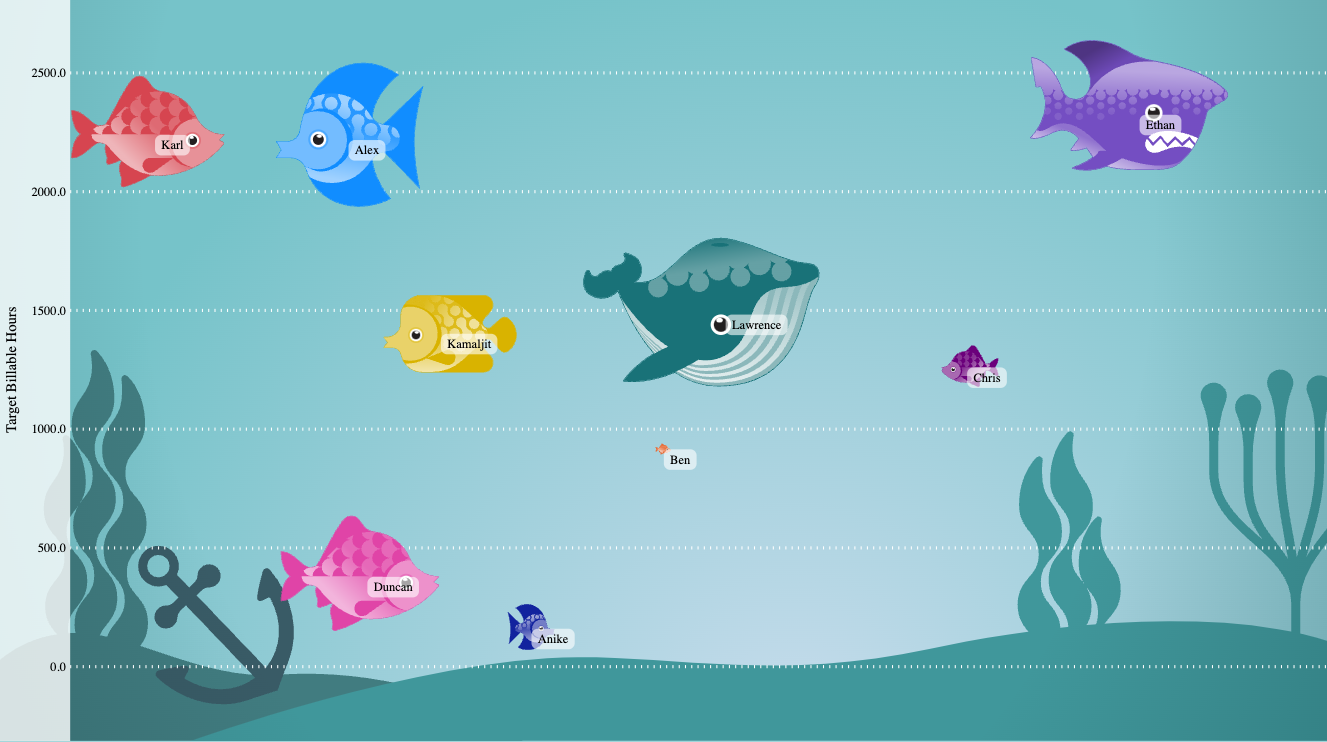
Sales
Motivate and monitor teams or individuals by showcasing sales against targets.
Who's the biggest fish this week?
marketing
Highlight campaign or channel performance, making it easy to spot outliers and act quickly.
What channel will break through the surface?
Human resources
Keep track of important HR initiatives like excessive holiday leave balances, or track recruitment objectives.
Who is swimming the fastest?
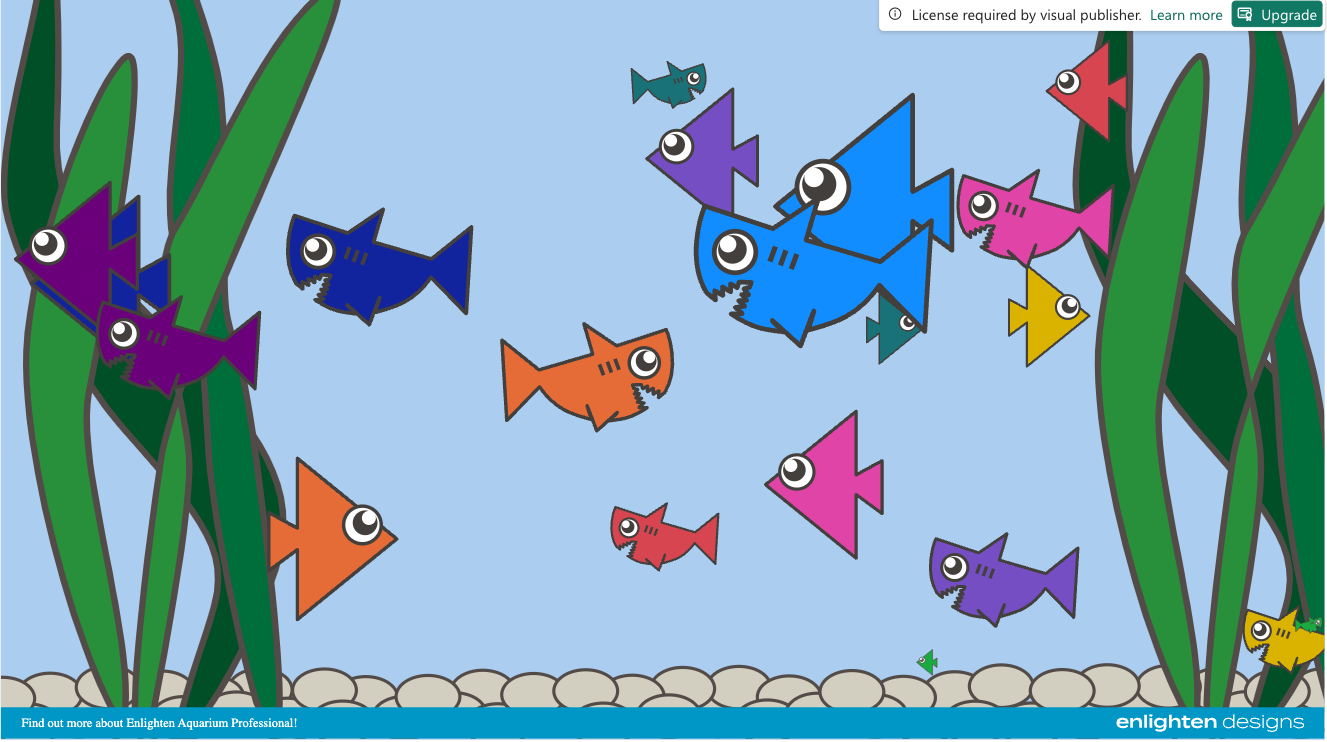
Support teams
Track support requests and highlight priority tasks for quick action and turn around.
Any red sharks this morning?
Try Pro today for free.
If you have feedback, questions, feature requests, or would like an entirely custom engagement visual we are ready to talk.
© Copyright Enlighten Designs Ltd. All rights reserved
Contact us: aquarium@enlightendesigns.com